-
23 February 2023Karsan Hydrogen Fuel Cell Bus e-ATA Hydrogen
-
17 July 2024Small City Buses: The Eco-Friendly Choice for Urban Commutes
-
23 September 2024Different Bus Sizes in Urban Transportation
-
02 October 2024What is a Shuttle Bus? How is it Used in Urban Transportation?
-
21 September 2026What Is Transit-Oriented Development (TOD)?
-
14 September 2026What Makes a Bus Truly Autonomous? The Sensors and Systems Behind Karsan's e-JEST
-
07 September 2026Measuring Sustainability in Public Transport: Which KPIs Matter Most?
-
28 August 2026Karsan × Toyota: Building the Hydrogen Bus of the Future
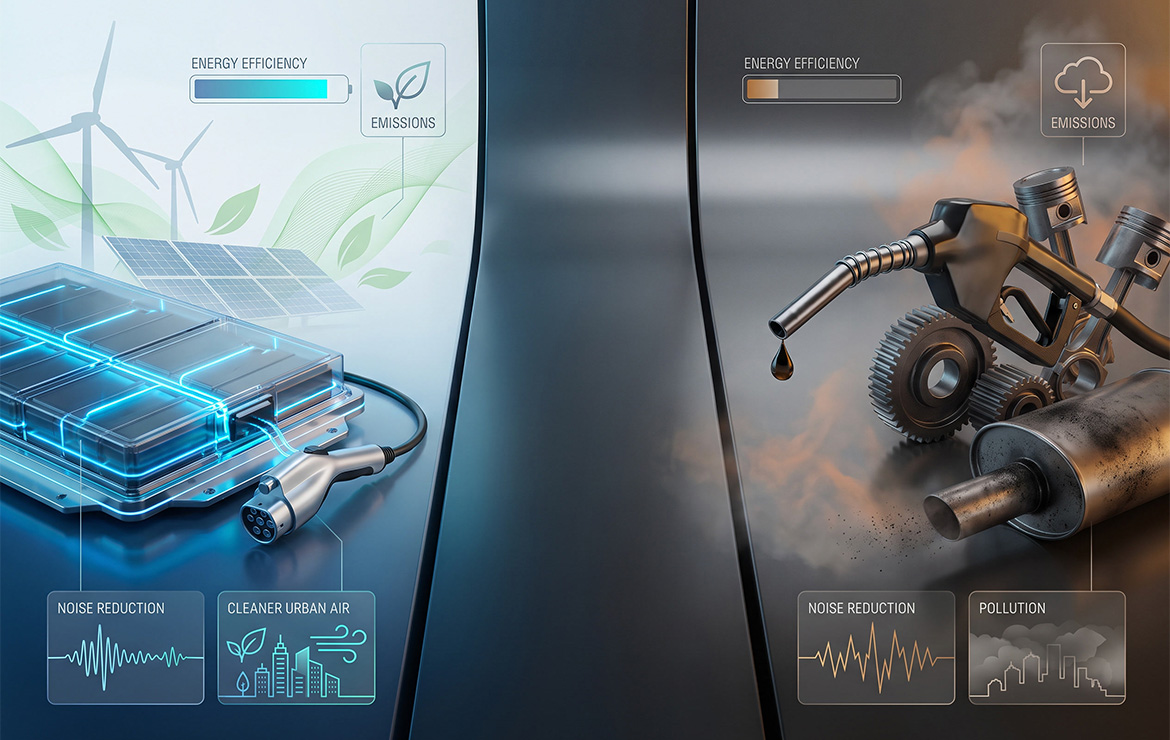
Municipal transit agencies worldwide are accelerating the transition away from fossil-fuel propulsion to fulfill ambitious climate mandates. Public transport is inherently one of the most efficient ways to move urban populations, but the environmental footprint of the vehicle itself dictates a city's overall sustainability performance. Comparing an electric bus with a traditional diesel platform reveals fundamental differences in carbon intensity, local air quality impact, acoustic footprints, and long-term energy integration.
Evaluating sustainability requires analyzing the complete lifespan of the vehicle from raw material extraction and manufacturing to daily operation and end-of-life recycling.
| Comparison Criteria | Electric Bus | Diesel Bus |
|---|---|---|
| Tailpipe emissions | No tailpipe emissions | Produces CO2, NOx, and particulate emissions |
| Well-to-wheel emissions | Depends on regional electricity grid mix | Dependent on crude oil extraction, refining, and diesel combustion |
| Urban air quality | Supports cleaner city air by eliminating localized exhaust | Contributes to local air pollution via NOx and PM2.5/PM10 |
| Noise pollution | Significantly quieter, especially during acceleration and idle | Higher engine combustion noise and mechanical vibration |
| Lifecycle impact | Upfront battery production carbon debt offset during operational lifespan | Continuous fuel combustion and ongoing refinery lifecycle footprint |
| Renewable energy integration | Can be charged directly with 100 percent renewable electricity | Limited renewable integration potential (restricted to low-blend biodiesel) |
Well-to-Wheel Emissions: Analyzing Total Carbon Intensity
Evaluating greenhouse gas (GHG) performance requires looking beyond the tailpipe to a Well-to-Wheel (WTW) analysis, which accounts for both fuel production (Well-to-Tank) and onboard fuel consumption (Tank-to-Wheel).
A conventional 12-meter diesel transit bus consumes approximately 35 to 40 liters of fuel per 100 kilometers, generating direct Tank-to-Wheel tailpipe emissions of roughly 1,000 to 1,300 grams of CO2 equivalent per kilometer (gCO2e/km). When factoring in upstream crude extraction, refining, and transport, total WTW emissions increase to 1,200–1,500 gCO2e/km.
In contrast, a zero-emission bus generates zero Tank-to-Wheel emissions. Its WTW emissions depend entirely on the carbon intensity of the regional power grid used for charging:
- High-Fossil Grids: Even on power grids dominated by fossil fuels (e.g., 600 gCO2/kWh), an electric city bus consuming 1.1 to 1.3 kWh/km yields WTW emissions of 660–780 gCO2e/km—achieving a 40 percent reduction compared to diesel.
- Average European Grid: On an average grid mix (approx. 230 gCO2/kWh), WTW emissions drop to 250–300 gCO2e/km, delivering a 75 percent to 80 percent lifecycle carbon reduction.
- 100 Percent Renewable Grids: Charged via solar, wind, or hydro power, operational WTW emissions approach near-zero levels (15–30 gCO2e/km from minor grid transmission losses).
On a passenger-kilometer (pkm) basis under average municipal occupancy rates, switching to an electric minibus or full-size battery-electric fleet reduces per-commuter carbon intensity from roughly 90 gCO2e/pkm down to under 20 gCO2e/pkm.
Urban Air Quality: Tailpipe Pollutants and Public Health
Carbon emissions drive global climate change, but criteria for air pollutants directly impact local public health in dense municipal centers. Internal combustion diesel engines release nitrogen oxides (NOx) and fine particulate matter (PM2.5 and PM10), which contribute to urban smog and respiratory illnesses.
Modern Euro VI diesel standards have significantly reduced tailpipe toxins compared to older fleets, yet urban stop-and-go driving, cold engine starts, and aging exhaust treatment systems frequently degrade real-world emissions performance.
Transitioning to an electric bus eliminates 100 percent of tailpipe NOx, carbon monoxide, and unburned hydrocarbons inside city corridors. While all rolling vehicles generate non-exhaust particulate emissions from tire wear and brake dust, electric vehicles equipped with regenerative braking reduce mechanical brake pad usage by up to 70 percent, further minimizing airborne dust. Fleet operators navigating strict municipal clean air mandates can examine regulatory strategies by reviewing Low Emission Zones: A Guide for Transit Operators.
Acoustic Footprint: Decibel Reduction in Urban Corridors
Noise pollution is an increasingly recognized environmental health hazard in dense urban areas, contributing to elevated stress levels, sleep disturbance, and cardiovascular risks for city residents.
Conventional diesel buses operate at ambient noise levels of 75 to 85 decibels (dBA) during idling, slow-speed maneuvering, and acceleration from station stops. Because the decibel scale is logarithmic, an increase of 10 dBA represents a doubling of perceived loudness.
An electric micro bus or full-size electric transit vehicle operates at 60 to 65 dBA at low speeds, a reduction of more than 50 percent in perceived noise. The absence of engine combustion noise and mechanical vibration creates quieter streetscapes, allows transit agencies to run night-time routes in residential neighborhoods without disruption, and significantly improves cabin comfort for passengers and driver personnel.
Full Lifecycle Assessment: Battery Production vs. Continuous Fuel Combustion
Critics of electric mobility often point to the environmental footprint of lithium-ion battery manufacturing. Extracting raw materials such as lithium, cobalt, nickel, and manganese requires intensive energy and mineral processing, creating an upfront "carbon debt" during vehicle production.
Comprehensive Lifecycle Assessments (LCA) conducted by the European Environment Agency (EEA) and the International Council on Clean Transportation (ICCT) show that manufacturing an electric bus generates roughly 15 to 25 percent higher embodied carbon than manufacturing a diesel bus shell. However, this upfront manufacturing impact is rapidly offset during active service:
- Payback Period: Under average urban driving conditions (approx. 40,000 to 60,000 km per year), an electric minibus offsets its manufacturing carbon debt within 1 to 3 years of operation, depending on the grid mix.
- Operational Lifespan: Over a typical 12-to-15-year municipal service life, the operational emissions of a diesel bus dwarf their original manufacturing footprint, whereas an electric platform maintains low operational emissions throughout its lifecycle.
- Second-Life and Recycling: Retired traction batteries retain 70 to 80 percent of their original capacity, allowing them to be reversed into stationary energy storage systems (BESS) for depot charging buffers before entering closed-loop material recycling processes.
Renewable Energy Integration and Holistic Green Transit
A major structural advantage of electric propulsion over internal combustion is its ability to decouple vehicle operation from fossil fuels entirely. Diesel engines remain locked into refined petroleum products or low-blend biofuels, offering limited scope for decarbonization.
Battery-electric fleets act as flexible digital loads on municipal power grids. By combining smart depot charging software, overnight off-peak power purchasing, and solar photovoltaic microgrids, transit agencies can ensure their fleets run on 100 percent renewable electricity. Furthermore, Vehicle-to-Grid (V2G) technology allows parked zero emission minibus and city bus fleets to supply stored energy back to the grid during peak demand events, stabilizing local energy infrastructure. Fleet managers exploring the broader ecological benefits of electric mobility can read Beyond Zero Emissions: The Holistic Impact of Green Transit.
Financial vs. Environmental Evaluation: Exploring TCO
While environmental metrics strongly favor electric platforms, municipal fleet procurement also requires evaluating financial feasibility, capital expenditure, charging infrastructure investments, and maintenance budgets.
For a dedicated financial analysis comparing capital costs, fuel savings, and long-term operational expenditure, read our comprehensive guide on Total Cost of Ownership: Electric Bus vs Diesel Bus .
Frequently Asked Questions (FAQ)
Are electric buses more sustainable than diesel buses?
Yes. Across their complete lifecycle, including raw material extraction, manufacturing, operation, and recycling electric buses generate significantly lower overall greenhouse gas emissions than diesel buses. Even when charged on electricity grids powered partially by fossil fuels, an electric bus achieves substantial reductions in lifecycle carbon intensity while eliminating tailpipe air pollutants entirely.
Do electric buses produce zero emissions?
Electric buses produce zero Tank-to-Wheel (tailpipe) emissions during operation, releasing no carbon dioxide, nitrogen oxides (NOx), or toxic exhaust particulates into city streets. However, their overall Well-to-Wheel carbon footprint includes emissions generated during electricity production on the regional grid, as well as non-exhaust particulate matter from tire and road surface wear.
How does the electricity mix affect an electric bus’s carbon footprint?
The carbon intensity of the local power grid dictates an electric bus’s operational emissions. Charging on a grid powered predominantly by coal yields higher Well-to-Wheel emissions than charging on a grid powered by wind, hydro, or solar energy. However, as global electricity grids continuously integrate higher shares of renewable energy, the operational carbon footprint of an electric bus automatically decreases over time without requiring hardware upgrades.
Does battery production make electric buses less sustainable?
While manufacturing lithium-ion batteries require mineral extraction and energy-intensive processing creating a higher upfront embodied carbon footprint during production this initial "carbon debt" is offset within 1 to 3 years of daily urban operation. Over a 12-to-15-year service life, the net carbon savings of operating an electric bus far outweigh its manufacturing footprint.
Are electric buses quieter than diesel buses?
Yes. Electric buses eliminate internal combustion engines, operating at noise levels between 60 and 65 decibels at low speeds compared to 75 to 85 decibels for diesel buses. This represents a perceived noise reduction of more than 50 percent, significantly reducing acoustic pollution in dense urban environments and residential neighborhoods.
References
- European Environment Agency (EEA). (2025). Electric Vehicles from Life Cycle Perspective: Carbon Footprint, Air Quality, and Battery Manufacturing Payback Benchmarks.
- International Association of Public Transport (UITP). (2026). Carbon Footprint Benchmarks per Passenger-Kilometer (pkm) in Municipal Bus Operations.
- International Council on Clean Transportation (ICCT). (2025). A Comparison of the Life-Cycle Greenhouse Gas Emissions of European Passenger Cars and Heavy-Duty Buses (Well-to-Wheel & Manufacturing Carbon Debt Analysis).
- Karsan E-Mobility Portal. (2025). Beyond Zero Emissions: The Holistic Impact of Green Transit.
- Karsan E-Mobility Portal. (2025). Total Cost of Ownership: Electric Bus vs Diesel Bus.
- Karsan Smart Cities Hub. (2026). Low Emission Zones: A Guide for Transit Operators.
- World Health Organization (WHO). (2026). Ambient Air Pollution, Urban Decibel Thresholds, and Transport Noise Guidelines.